Reconstructing Grading Practices in American Classrooms: A Project Whose Time Has Come
What about authentic assessment? A guest post by Terry Underwood!!!
Join and I for a LinkedIn Live on November 20th with moderating an insightful discussion about our new e-book on AI in education.
Rob, former Executive Director of Academic Technology and Planning at UPenn turned full-time writer, brings unique perspectives on generative AI's impact on education.
Register: https://docs.google.com/forms/d/1Y8JNlz4-YzUls_qtCPYHEE8Iw7_bTmsVDuBk8wDWVjY/edit?ts=672bfd7a
Get the e-book: https://shorturl.at/FP4I2
First 20 registrants receive a free chapter!
Nick’s Introduction:
In August of this year,
tackled the thorny intersection of standardized testing and classroom grading systems in American education. His analysis revealed how our current evaluation methods often work at cross-purposes - with standardized tests pushing one way and classroom grades another, creating what he termed "opposing purposes." He identified four critical themes emerging in grading reform efforts: alternative grading approaches, equity and mental health concerns, technology's role in grading, and the need to examine grading practices in broader context.Now, Terry builds on these insights by sharing a fascinating case study that reimagines assessment through the lens of the APGAR scoring system. While last month's piece diagnosed the systemic problems, this follow-up shows us what solutions might look like in practice. His 1994 research at a Title I middle school demonstrates how three English teachers successfully separated daily assessment from final grades - addressing many of the equity and mental health concerns he previously highlighted. By empowering students as self-assessors and establishing external portfolio review committees, they maintained academic rigor while fostering deeper engagement.
The results offer compelling evidence for how we might resolve the tensions between standardized measures and meaningful classroom assessment that Terry outlined in his previous analysis. As AI continues to disrupt traditional evaluation methods, this research provides timely insights into creating more authentic, growth-oriented assessment systems. How can we teachers use portfolios to establish new grading norms and routines that maximize the benefits and minimize the obstacles of AI systems?
Follow Terry at his Substack:
Nick Potkalitsky, Ph.D.
I. The Miracle of the APGAR Assessment
Imagine Sarah Peterson, RN, standing ready at the warmer as Dr. Martinez delivered a male infant at 15:42. The baby emerged with a good cry, and Sarah began her systematic APGAR assessment at the one-minute mark.
Starting with Appearance, she noted the baby's color. The infant's trunk and limbs showed good pink coloration, though the hands and feet retained a concerning bluish tinge, a fairly common occurrence when anesthesia has been used.
"1 point for color," she documented.
Checking Pulse, she placed her fingers gently on the umbilical stump. "Heart rate 140, strong and regular.
2 points," she noted and smiled. Below 100 indicates a score of “1.”
For Grimace or reflex irritability, Sarah observed the baby's response as she dried him with a warm towel. The infant pulled away vigorously and let out another good cry.
"2 points for reflex response," she recorded.
Assessing Activity, she watched the newborn's movements. The baby demonstrated active motion, flexing and extending all limbs.
"2 points for muscle tone and movement."
Finally, for Respiration, she observed the baby's breathing pattern. Strong, regular cries continued with good chest expansion.
"2 points for respiratory effort."
"APGAR is 9 at one minute," Sarah announced to the room, documenting the score in the electronic health record.
At exactly five minutes post-delivery (15:47), Sarah performed her second APGAR assessment. The baby maintained strong vital signs and activity level, pink color had spread to the extremities, and respiratory effort remained robust.
"Five-minute APGAR is 10," she confirmed, updating the chart while maintaining visual contact with the infant.
As she completed her documentation, Sarah noted: Time of birth: 15:42 1-minute APGAR: 9.*
“The Apgar scoring system [is] an evaluative measure of a newborn's condition [to determine] the need for immediate attention. [I]ndividuals have unsuccessfully attempted to link Apgar scores with long-term developmental outcomes. This practice is not appropriate, as the Apgar score is currently defined. Expectant parents need to be aware of the limitations of the Apgar score and its appropriate uses.”
The APGAR system elegantly demonstrates authentic assessment at its finest: A highly educated expert brings a trained, experienced eye to a growth moment. Here, the nurse's professional education and clinical experiences become an instrument of discernment, the embodiment of medical science, translating a newborn’s condition and needs into actionable insights.
Like a well-calibrated array lasers, the APGAR's rubric brings five vital aspects of newborn life into sharp focus—from the flush of healthy skin to the vigor of that first cry. Its genius lies in transforming expert subjective perceptions into shared professional vision; a nurse in Seattle will look for exactly what a midwife in Boston will, their assessments valid and reliable through carefully defined and vetted criteria, a testament to shared epistemological values in their own education.
Yet the APGAR is not a static snapshot taken simply to record the event for grading purposes or to communicate with parents in a conference about how hard the infant is cooperating and learning. By calling for reassessment minutes later, the second APGAR makes salient micro-level changes for better or worse. But it doesn’t stop there.
An APGAR score below 7 can indicate that the infant needs medical intervention to scaffold the transition from the womb to the world. Airway management and oxygen support, from suctioning to oxygen masks to intubation to mechanical ventilation are instantly available. Cardiopulmonary resuscitation (CPR) and epinephrine are on standby.
This watchful, iterative, precision care exemplifies how authentic assessment becomes dialogue between action and response, the nurse wraps the towel, the baby squirms, the nurse notes it, between expert and expert, the nurse calls out the score, the team fetches oxygen, between each perception, skin color at extremities, pulse, between observation and interpretation illuminating the path toward what now, what next…
II. The Model of the APGAR
Much, though not all, of the unrest underlying the emergence of strategies like ungrading or grading for equity derives from university professors in health education and medicine, the natural and physical sciences, engineering, and mathematics. Traditional grading practices come with the expected array of bad effects—anxiety, competition, diminished emotional wellbeing, etc.—all of which are self-generated and self-perpetuated. More authentic assessment classroom approaches deemphasizing evaluation by way of assign-and-grade practices are flourishing.
University professors have grown increasingly frustrated with traditional grading practices. STEM professors, for example, recognize that their disciplines demand more than progress metrics. In organic chemistry, for example, a "C" student who grasps only 70% of molecular bonding concepts isn't ready for advanced biochemistry, regardless of how much they improved over the semester. The issue resonates with the APGAR analogy in that STEM requires a decision now. This infant will need CPR if it isn’t suctioned and oxygenated within the next two minutes.
In organic chemistry, for example, a "C" student who grasps only 70% of molecular bonding concepts isn't ready for advanced biochemistry, regardless of how much they improved over the semester. It really doesn’t matter to the discipline how hard they worked, how interested they were, important as these aspects are. Unless C is mastery, the system is setting the learner up for failure. It doesn’t get easier; it gets harder.
Some scientific concepts require complete, finite mastery. Students must fully grasp how the specific shape of lactase allows it to split lactose (milk sugar) into glucose and galactose. Knowing that lactase "does something" to milk won't suffice in this class. No matter how hard a student works, no matter how curious they are, when a lactose-intolerant patient drinks milk, their body's lack of functional lactase isn't a partial success, but an unmitigated disaster all over the floor.
STEM presents a different constellation of issues than, say history or world religions. In the situation referred to below, two sources of inequity trouble STEM teachers, one within the discipline where learners face unreliable evaluation, the other across the university where STEM students hold lower GPAs than other disciplines. In this situation, the problem isn’t that grades coerce learners or rob them of agency. It’s simply a matter of reliability and fairness. In this situation teachers need the objective eye from nowhere, the perspective of the unbiased evaluator. The rating is an APGAR score. Witness this recent study (Tompkin, 2022, Journal of STEM Education):
“Conclusion: Observed GPA is a systematically biased measure of academic performance, and should not be used as a basis for determining the presence of grading inequity. Logistic models of GPA provide a more reliable measure of academic performance. When comparing otherwise academically similar students, we find that STEM students have substantially lower grades and GPAs, and that this is the consequence of harder (more stringent) grading in STEM courses.”
According to this study, statistical models can account for multiple factors inherent in learning potential and adjust GPAs for comparison purposes, using more reliable indicators. The key word here is account for—not control, not define, not limit, but account for. Like a map that helps us understand terrain while acknowledging it can never capture every pebble and blade of grass, statistical models offer valuable insights into learning potential.
When thoughtfully constructed, statistical models can illuminate patterns and relationships in learning that might otherwise remain invisible. Later in this paper, I will rely on fairly simple statistical models to account for the outcomes of an experiment in portfolio assessment. Note that the results of this quantitative research in STEM—like my research—are not intended to serve immediate instructional purposes as an APGAR-like score would. Moreover, these macro analyses aren’t about individual classroom teaching. That doesn’t mean numbers aren’t useful or important. They are relevant to institutional issues. It wouldn’t be a stretch to say that institutional research must filter out the details and reach a summary indicator like a mean score or a count.
Educational researchers use statistical models to better understand how various factors, e.g., socioeconomic background, prior knowledge, learning environment, teaching methods, peer interactions, cognitive development, etc., interweave to influence learning outcomes—or in this case, GPAs as proxies for learning outcomes.
If the researcher has a robust model of the underlying aptitudes and likely capacities of two groups of 3,000 students, say, one group from STEM classes, one from Humanities classes, for example, predictions comparing students with similar aptitudes, discipline for discipline, shows that STEM students actually get graded significantly lower than their aptitude would predict if they were in the humanities disciplines.
Bluntly—if the goal is to sustain a higher GPA, don’t go into STEM. This difference in grading probably distorts how learners apprehend the nature of “majors” and “minors” and could bring about poor student choices.
When we use models to create figured worlds of students of equal academic ability, a clear pattern emerges: STEM course instructors grade more harshly than other departments, resulting in lower GPAs for STEM students who are just as capable as their peers in other fields. To my mind, this finding calls attention to a serious problem.
This study suggests that grades as they are currently used are inadequate as a blanket solution to the problem of communicating about student competence reliably, fairly, and validly across the curriculum. Solutions like ungrading address the STEM part of the curriculum (.25 points lower in general than grades in Humanities) and may address others like music where technical matters lend themselves more readily to APGAR-like scores. Bur the final solution will require investment of time and resources. It can’t happen classroom by classroom without systematic .institutional engagement.
Perhaps energized by concerns from STEM professors, a different kind of resistance to our laissez faire approach to grading has sprung up—different in regard to the Humanities. Whether driven by equity or fairness, this coalition is also interested in fulfilling a felt obligation to society for certification of competence while minimizing harm to students.
Frustration with under-theorized and highly variable grading practices persisting in practice rather than institutionally applying guiding principles from learning science is growing. Statistical analyses can account for factors that might be amenable to improvement BEFORE and AFTER the learning has taken place, not while the butterfly is flying. Solutions to problems of massive proportions require mixed methods, including statistics and observation.
Students don’t need grades to grow and learn. But they need to know what it means to master something. And institutions need to know whether students are mastering something. Are grades coming up roses in a cost-benefit analysis?
When we talk about the eye from nowhere, the unbiased judge, we're not talking about artificial objectivity or arbitrary standards. We're talking about the kind of human, calibrated vision that comes from total immersion in a practice or discipline. Just as nurses know "something's not right" before they can name it, masters in any field develop this third eye, a way of seeing that transcends both wild subjectivity and cold, mechanical measurement.
Students don't need grades to work hard enough to become an expert, but they do need access to this calibrated vision, this third eye that can recognize mastery. They need to trust it.
They change as learners after they see themselves through the eyes of expertise. Once they understand what mastery looks like from nowhere, not just from their personal perspective, they crave getting a bead on their trajectory toward mastery. What do I need to do to get there? What can I try? How can I get better? Winning isn’t the prize. Getting better makes it worthwhile.
Students don’t need grades to grow and learn. They need to understand the criteria of mastery of something and get guidance on how to achieve them holistically..
Learners want to know what it means to work toward becoming a master, especially inside their own curiosities. Curiously, becoming a master in one domain can inspire a drive for mastery in others. In this situation, the problem isn’t that grades coerce learners or rob them of agency. It’s simply a matter of reliability and fairness. In this situation teachers need the objective eye from nowhere, the perspective of the unbiased evaluator. The rating is APGAR .
Raw GPA numbers in general mislead because they contain built-in false equivalencies. Consider two students with 3.5 GPAs. One might have earned steady B+ grades across all courses, while another earned A's in humanities and C's in calculus. Identical GPAs mask very different academic journeys. To compare grading fairness across departments and disciplines, false equivalencies call into question any specific statistical findings.
III. Middle School English Classrooms without Grades
Rewinding to 1994, I’m going to revisit the research on portfolio assessment I completed for my dissertation and reflect on it in light of the APGAR narrative.
Completed in 1996, published as a book in 1999 by NCTE, my research project employed mixed methods to collect and analyze data from the field through a) ethnographic observations in classrooms, b) interviews with teachers and students, c) hermeneutic circles with students, d) document analysis, e) a writing test scored intra-personally, f) a constructed-response reading test scored with a rubric, g) analyses of grade distributions, and h) a survey of academic achievement motivation.1 2
Mixed Methods
A quick note about mixed methodology. In the 1990s I experienced quantitative and qualitative researchers in opposing camps, sometimes bitterly. Alliances derived from epistemological axiologies within research traditions, emancipatory disciplinary histories vs scientific objectivism, levels of abstraction of research questions/territories about education, and more. Psychology-oriented research privileged numbers; anthropologically-oriented research privileged verbal and visual data.
With an interest in both modes of science and an expectation of learning the rudiments of each, I was quiet about statistical analysis in qualitative methods courses and seminars unless something seemed really important to say. Generally, in those settings, I was fascinated by the qualitative data we grounded seminar discussions in. In quantitative settings it wasn’t a problem. Class was an hour of lecture and demonstration followed by an hour with a partner in the lab running scenario tests using Apple’s DataDesk for two magnificent quarters, a stats program I grew to love. I got pretty good at it. I found both methods incredibly interesting. I wanted my dissertation to use mixed methods in the worst way, mainly to find out how to reconcile them.
I can’t imagine a world without both methods, though I know from admittedly limited firsthand experience quantitative research is not hot in pedagogical research. Numbers can make people angry—on both sides, whether you like numbers or not—somebody can be offended. Partly, this resistance derives from the way statistical analysis itself has its own subjectivity. How researchers define factors, what instruments they choose to measure with, indeed even what question is deemed worth asking often ‘slants’ a quantitative study in unavoidable ways. In my experience, in tandem numbers and words put together in a dialectic worked as I thought they would. Qualitative data helped me to make meaning from numbers; numbers raised questions that cried out for qualitative analysis. Numbers need stories; stories need numbers.
Significance of This Story
From this study I can offer modest insights into a cultural trap door in every classroom where teachers and learners can evade grading distortions while keeping objective grades robust and meaningful, an escape clause from learner compliance or resistance, an administrative sleight-of-hand transforming teachers into mentors, that opens a space where teachers and learners can talk about schoolwork and learning without fear or favor.
This is not a story of the privileged. I—we, my colleagues at Ruff Middle School in 1994—heard rerun stories of gunshots in the parking lot, drug deals in the quad, a few years earlier. This was trench teaching. The lunch periods were high-alert times, though nothing spectacular ever happened while I taught there.
In a Nut Shell
At a Title I middle school, three English teachers transformed classroom dynamics by decoupling day-to-day assessment from final grades. While maintaining their core teaching practices, they reimagined the grading process by elevating students to become primary assessors of their own work and advocates for their own learning. They accomplished this elevation by way of a formal, structured, and sanctioned portfolio pedagogy and an external portfolio examination committee.
The teachers shifted into "mentor assessor" roles, observing, negotiating, and guiding rather than monitoring, evaluating, and prescribing assignments. They developed APGAR-like rubrics which would ultimately inform summative grading in the hands of an external jury, but the daily instructional focus remained on student-guided self-assessment vis a vis criteria rather than on traditional assign-and-grade.
A hypothetical student might ask “What’s my grade?” three weeks into a grading period. A portfolio teacher might respond, “I don’t know. What do you think it is? What did we say it was a few days ago? Didn’t we just talk about challenge? You’ve been reading horror books and writing Halloween stories! Now explain in your text log analysis how these books are evidence of challenge. Self-selected does not mean easy and fun.”
This approach particularly suited their Title I context, where many students struggled with traditional assignment-grade methods in the intermediate grades. The emphasis on self-regulation and metacognition helped build student agency and confidence while maintaining academic rigor.
They would teach as they had been teaching in all other respects. They had already been using a workshop style pedagogy for reading, though their writing instruction had been more regimented. They would position students as primary assessors, self-assessors, self-regulators, and they as teachers would be mentor assessors, seeing the classroom through APGAR-like rubrics that would be the filter applied during summative assessment.
Students would be guided through a sequence of portfolio production activities which commenced roughly two-thirds of the way through the trimester. While wrapping up current projects, classroom activity turned toward writing the orienting, analytic, and reflective papers the examination committee relied on to issue a final grade.
Two decisions loomed large. First, learners had to select pieces of writing and evidence of process to contextualize in an entry slip and explain the relevance of the evidence to the learning criteria for the examiner teachers. Second, they had to reread and analyze six weeks worth of reading log and write an examiner’s guide to the logs. They had to make their case for a grade on the rubric using the evidence at hand. They were self-advocates.
The Formal Study
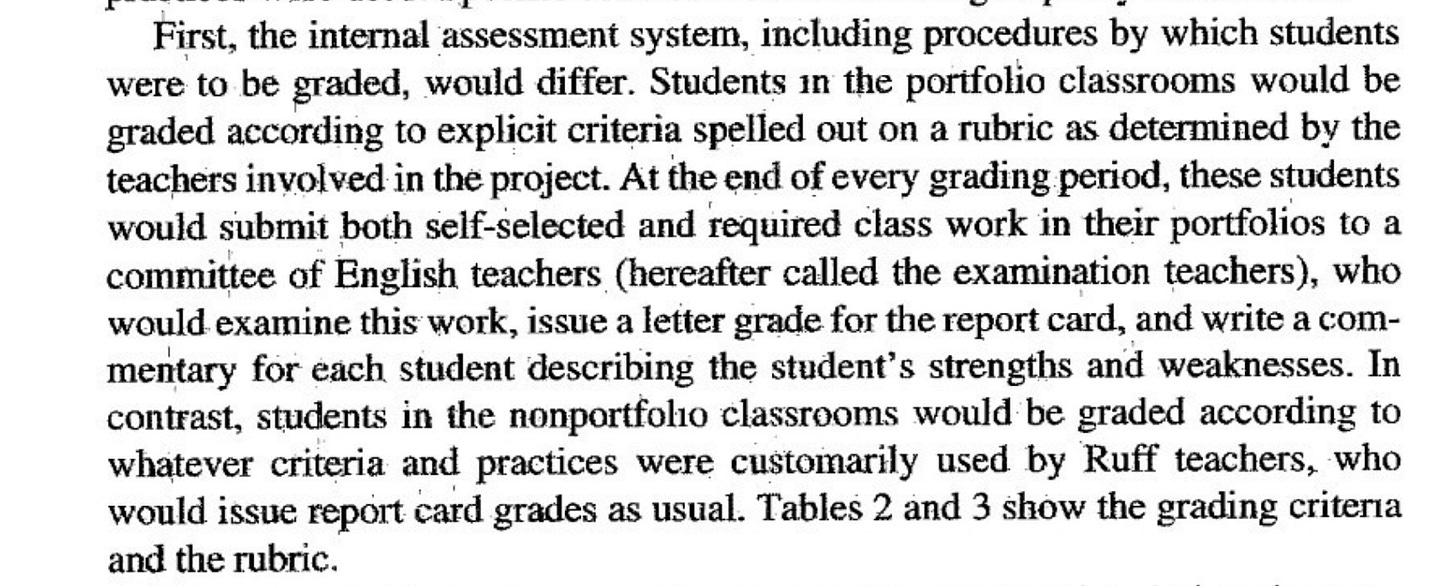
To represent this study in detail, I’m drawing on two studies, one I published as a single author in the journal Educational Assessment in 1998, the second I published with Sandy Murphy in the journal Assessing Writing also in 1998. The following excerpt provides background on the research topic as I defined it for the dissertation. For my purposes in this post, note the reconstruction of lines of authority for issuing grades. Procedures for grading differed from the tradition in one significant way: The classroom portfolios teachers would have everything to do with assessing their students, but very little to do with grading their students, a decision worth revisiting in future research:
No one proposed eliminating the requirement that teachers must assign letter grades at the end of each trimester. No one argued they should be eliminated. One group of three middle school English teachers, however, were given permission from site administration to transfer responsibility to grade their students from themselves to their colleagues. Grades would remain as usual, no asterisk in the transcript. The portfolio teachers would submit their grade rosters as usual.
All of the students, scheduled randomly in class periods taught by the three portfolio teachers (AllPT), would learn to read and write in English under the guidance and direction of their teacher using the portfolio rubric and assembly protocol as the boundaries of the work. Along the way they would learn strategies to display their learning in reflective analysis and to discuss their artifacts for others to see. Importantly, to get a good grade, they needed to show what they learned from their own literacy experiments intended to help them grow. This requirement meant they would naturally talk about their self-perceived weaknesses and their failures. Failure was not a bad thing but an inevitability. The grading question is this: What did you learn from it? Near the end of the grading period they would organize a showcase portfolio to display, contextualize, and advocate for their accomplishments in their best light.
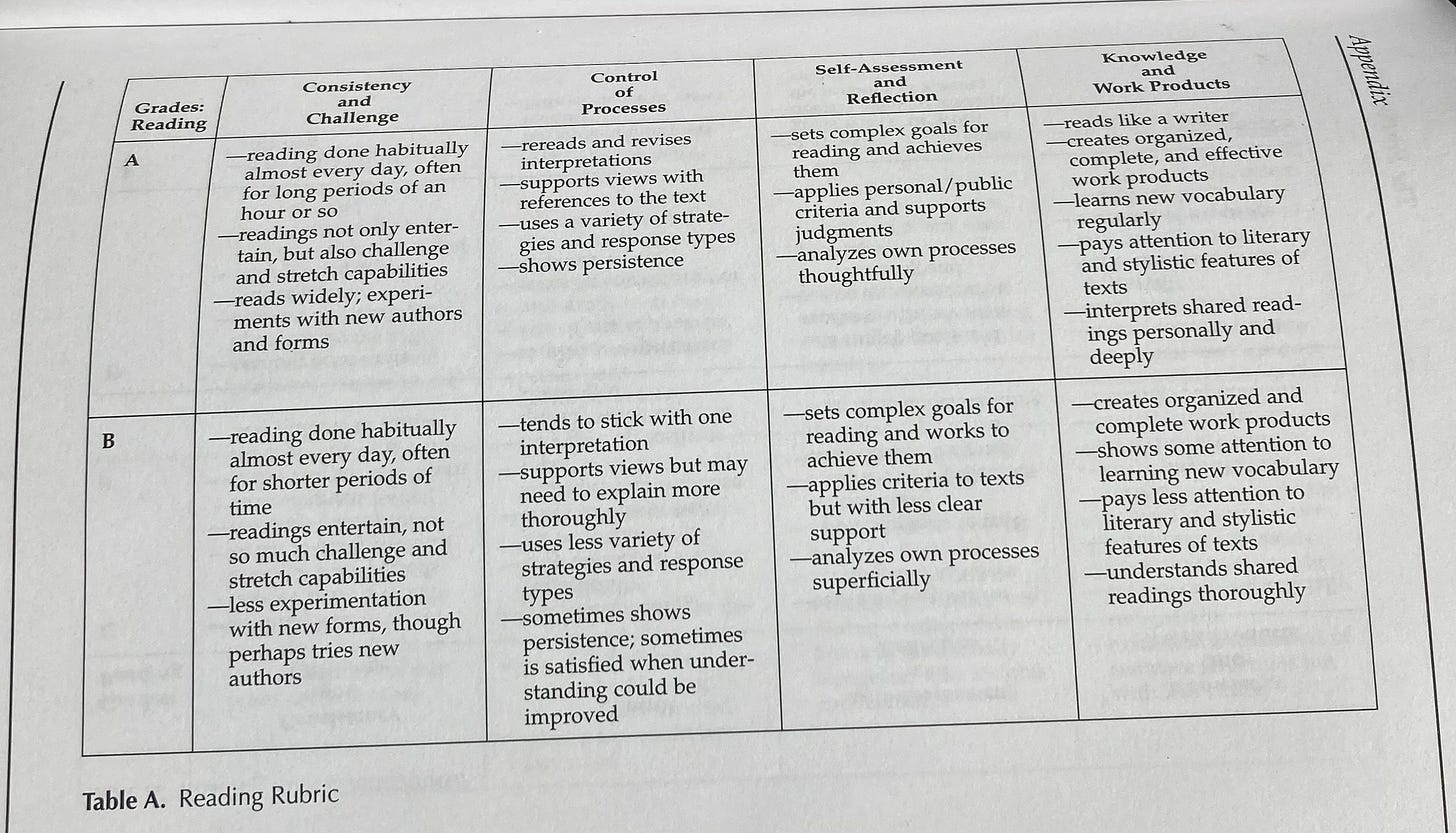
Between trimesters a committee of English teachers known as the “examination committee” would issue report card grades for AllPT (200+ portfolio students). Here is a portion of the rubric representing “A” and “B” work in reading performance after a trimester. The examination committee looked for and applied these standards:
Like APGAR, this rubric framed the trained eye's way of seeing and knowing a human being in transition at a critical moment. Just as a nurse notices the subtle qualities of a newborn's cry or color, here we see teachers attending to the vital signs of a developing middle school reader regardless of starting point, not just whether they're reading, but how they're living with texts, how they're breathing with them. The rubric also gave the students what they needed to fashion their own lenses on their learning. What exactly does a strong reader or writer do?
Notice the shared professional vision embedded in the tools. APGAR doesn't just ask "Is the baby pink?" but raises the significance of "pink" versus "blue" in that first crucial assessment. Similarly, this rubric doesn't ask "Did they read?" but guides examiners to notice the quality of engagement, the difference between reading that's easy, random, here today gone tomorrow, and reading that shows persistence and experimentation—even if in context of trashy horror stories.
Both frameworks honor complexity while making it manageable. Like APGAR's five criteria that index the features of a newborn's transition to independent life, these four dimensions capture a reader's journey toward literary independence. And in both cases, the assessment exists not to judge but to guide the next supportive action.
Perhaps most importantly, both tools create a shared professional language for noticing what matters most at a crucial developmental moment—the wild world of adolescents. This language becomes part of the jargon of the class. The words pop out of students’ mouths unbidden. They give structure to expert intuition without reducing it to naked measurement. They elaborate and codify the meaning of a grade in a concrete description of evidence applied by an expert rater. Ideally, the student, teacher, and examiner see things in the portfolio the same way.
The difference between A and B here, like the difference between APGAR scores, isn't about ranking. It's about recognizing where support might be needed, about seeing clearly so we can help wisely.
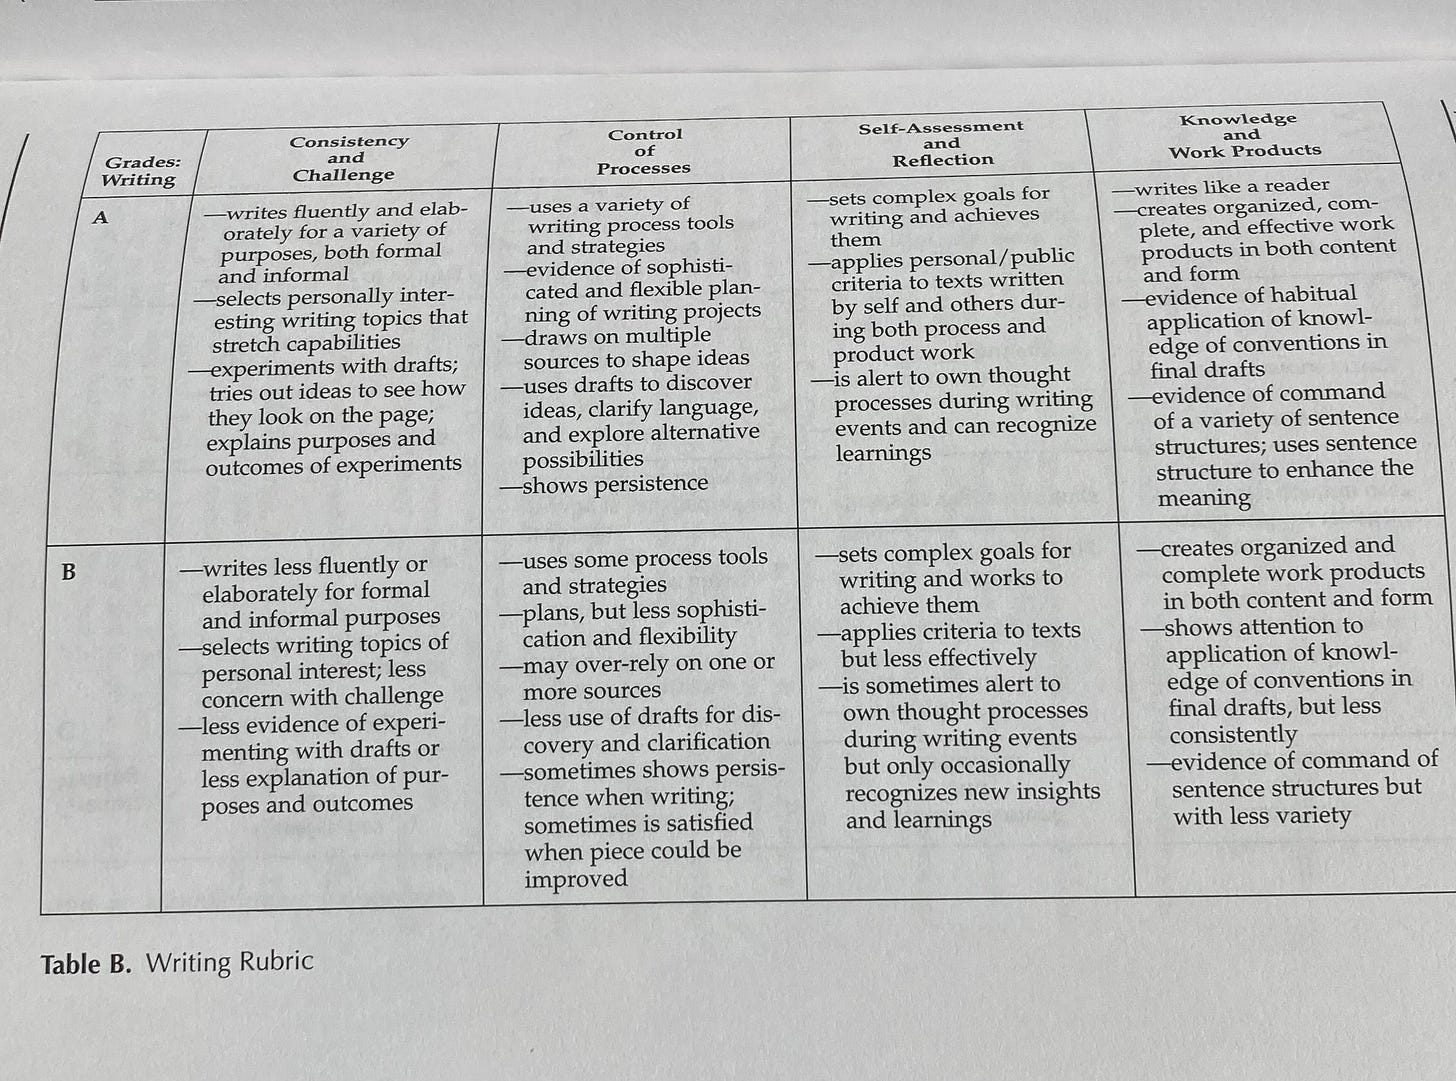
Similar criteria were applied to writing:
This writing rubric reveals even more powerfully the parallel with clinical assessment, perhaps because writing, like breathing, is such a vital sign of intellectual life. Like breathing in cold weather, we can see the foggy evidence.
APGAR guides clinicians to notice not just if a newborn is breathing but the quality of that breath, its strength, its regularity, its effectiveness. This rubric teaches us to notice not just if a student is writing, but the vitality of that writing. The clinician's look at"respiratory effort" becomes the teacher's attention to "fluency and elaboration"; both are watching for signs of sustainable, independent life.
Notice how both frameworks attend to persistence and effort. APGAR looks for robust responses to stimulation; here we watch for how a writer "experiments with drafts" and "shows persistence." Both tools are for reading signs of engagement with the world in a healthy struggle, for reading the inner life of a child in an effort to help the child tune in instead of tuning out.
Most tellingly, both frameworks understand that vital signs interact. Just as a good APGAR score reflects the integration of multiple systems—respiratory, cardiovascular, neurological— this rubric shows us how process control, self-reflection, and knowledge work together in the healthy writer. Neither tool simply counts; both help practitioners see patterns that matter.
And in both cases, the B score (or lower APGAR) isn't a judgment, but a description leading to an alert. It helps teachers see where support is needed, whether that's respiratory assistance or more structured guidance with drafting. The assessment exists not to grade for a grade as the highest value, but to guide our care—and to alert other stakeholders of a learner’s status. Professional vision at its finest gives language to subtle signs of developing strength as well as need that experienced practitioners learn to notice and nurture.
The Rubber and the Road
The examination committee spent 3-4 day sessions scoring and writing feedback for 200 portfolios during three scoring sessions across the year. As a committee, they agreed to a jury style of consultation; when any rater needed a thought partner they could consult with another rater.
The portfolio teachers stopped in to see how the grading was progressing. They didn’t discuss substantive issues around the portfolios with the judges. I didn’t observe any discussions between the examination teachers and the portfolio teachers. In hindsight, that was a missed opportunity. It would be valuable now to know qualitatively about how these teachers would have worked together, but the financial resources to do it would have been substantial.
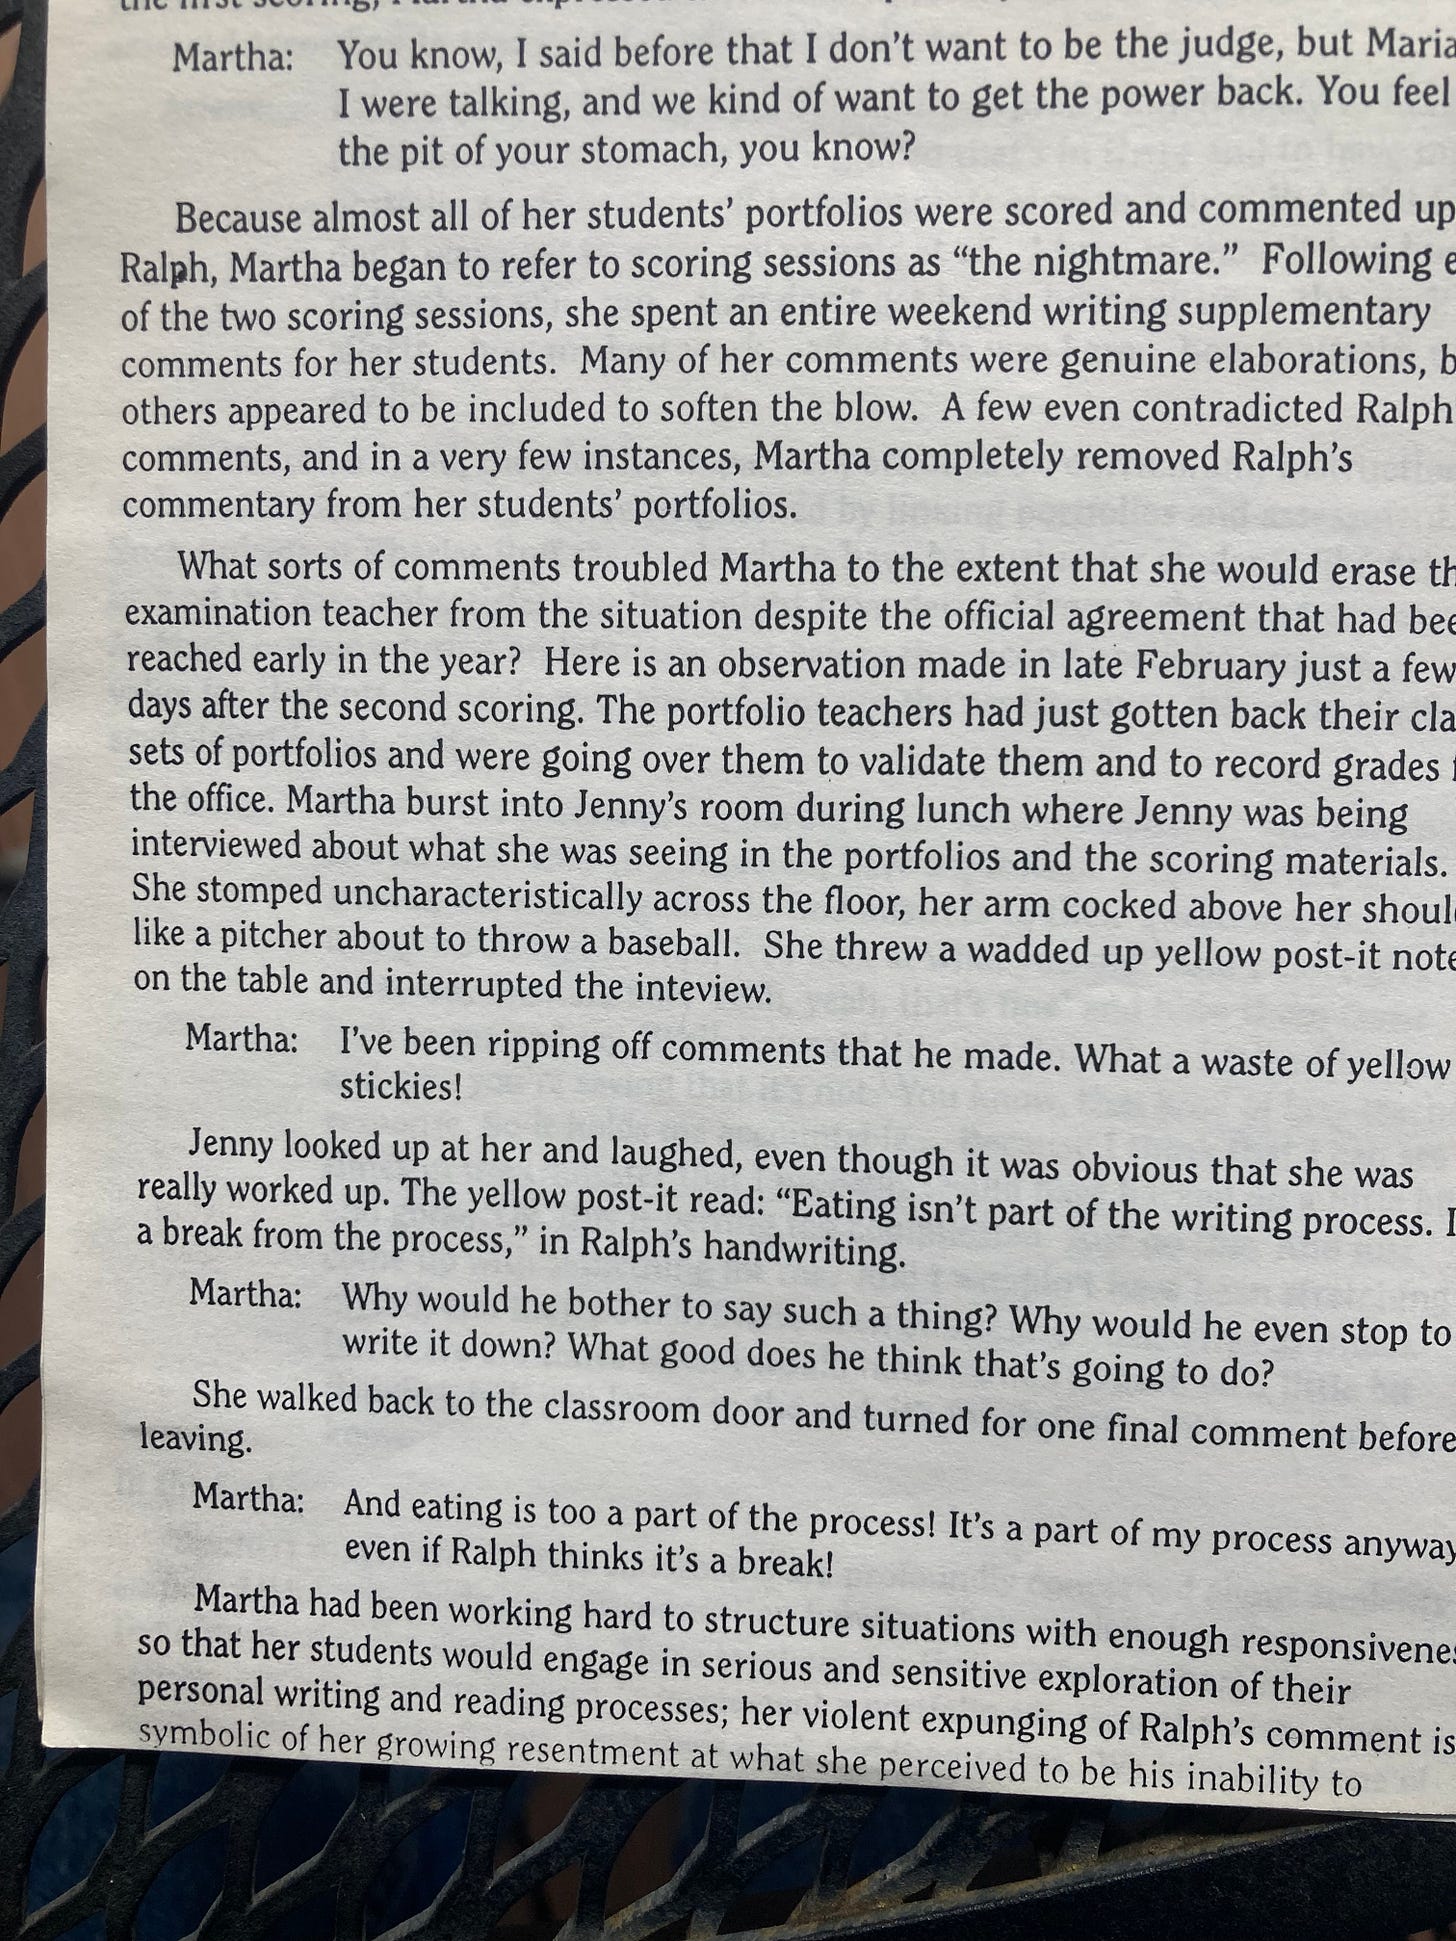
After the first scoring, yellow sticks became a real issue, an interesting one, involving Martha, a portfolio teacher, and Ralph, a portfolio judge. I think of it as the Battle of the Yellow Stickies. (These data are documented in Underwood, Murphy, & Pearson (1995) Iowa English Bulletin, 3, 43-52.)
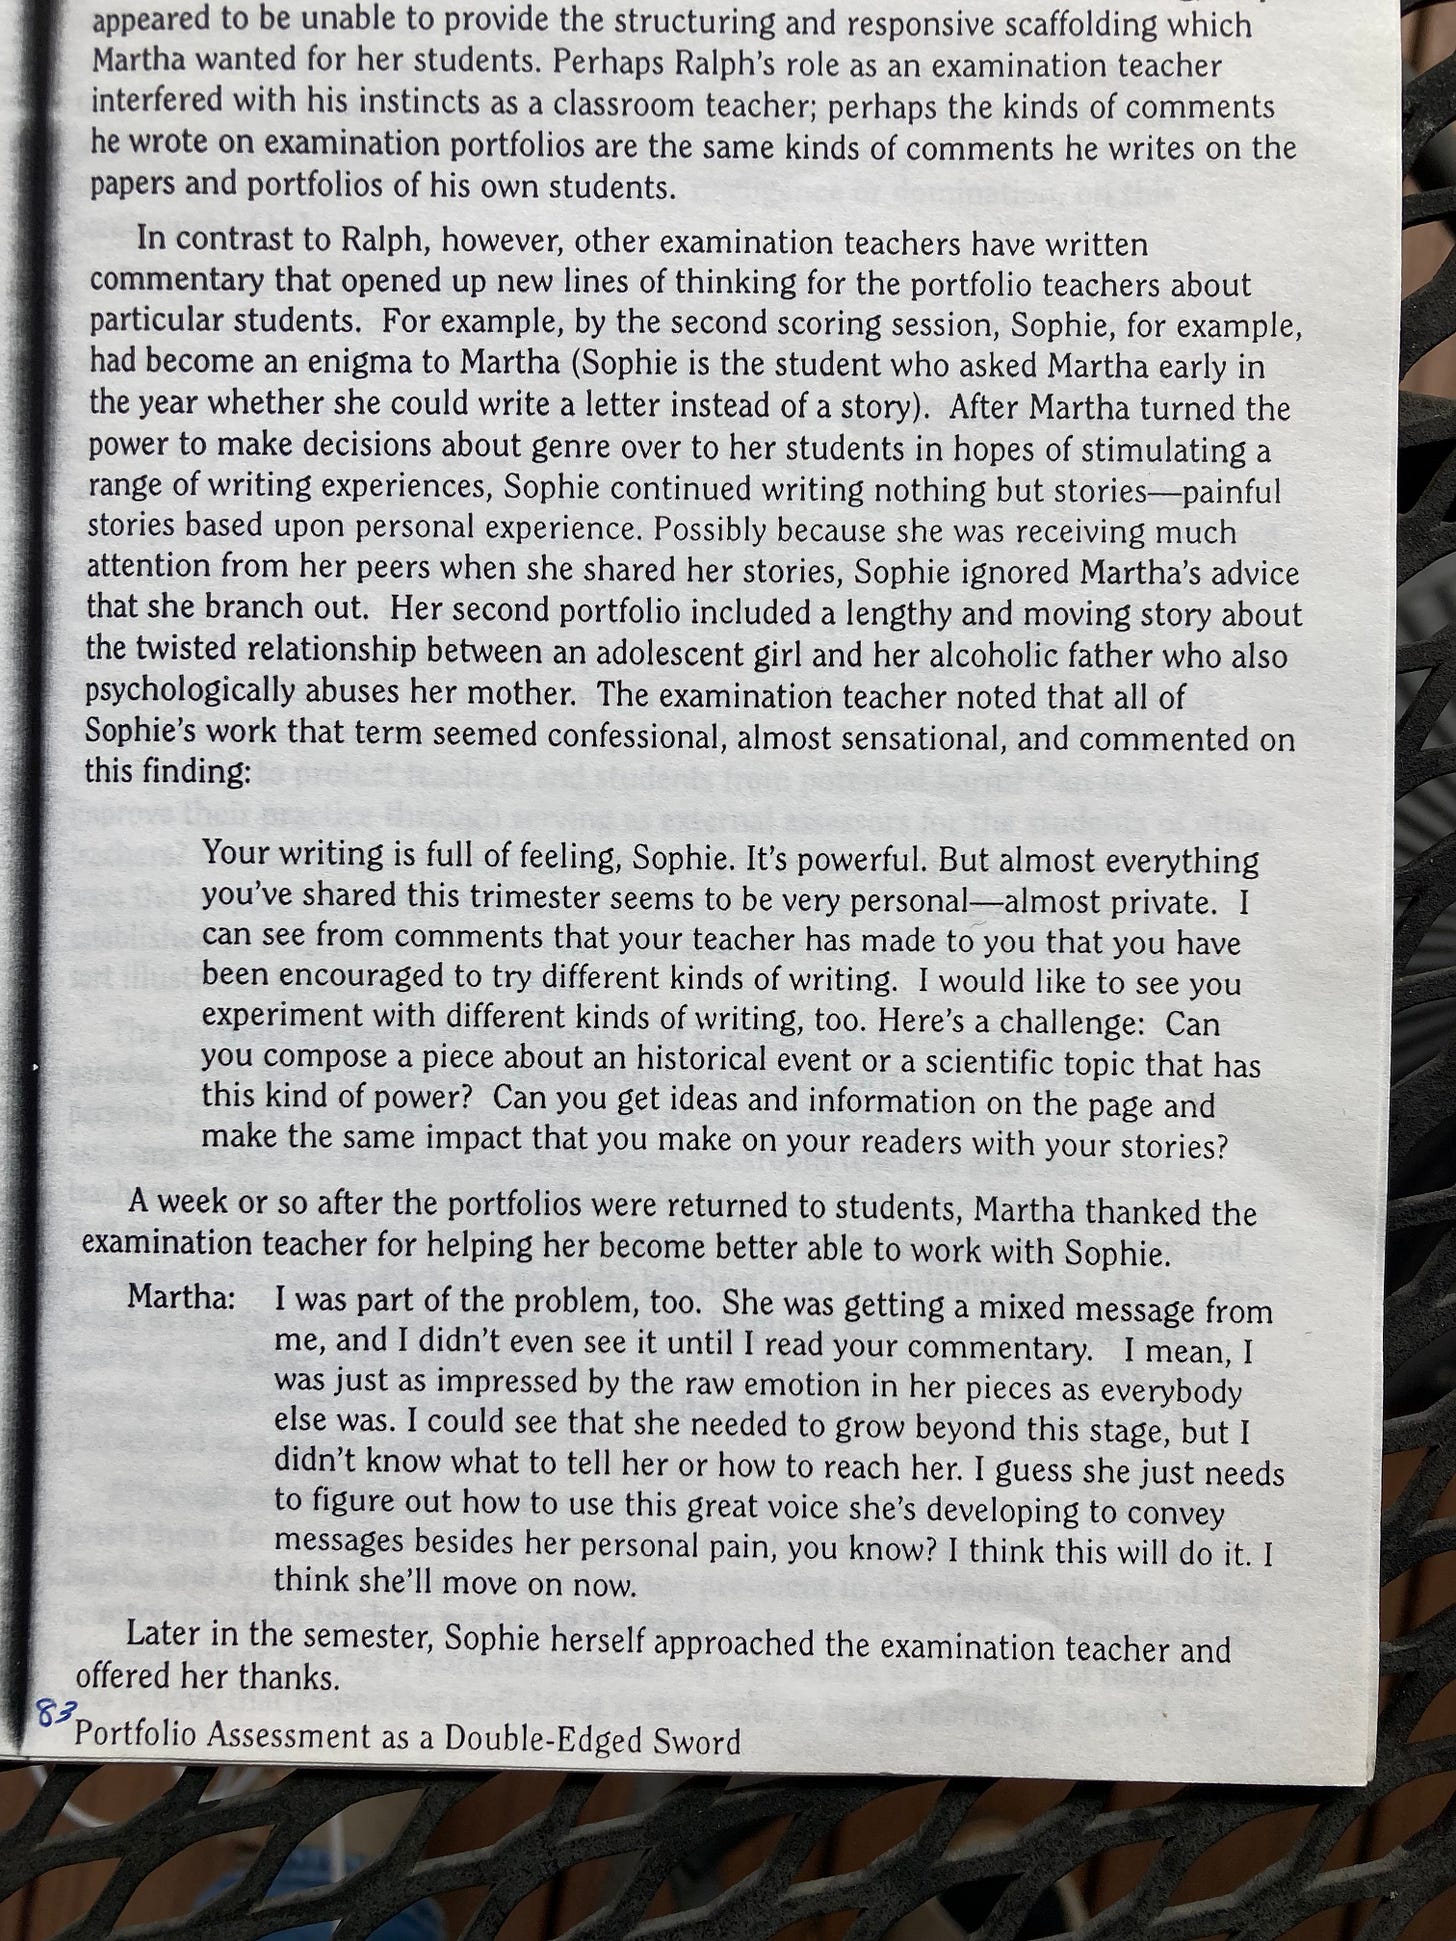
Note that Martha didn’t dispute the grade Ralph had given. She was fine with it, but Ralph’s written feedback to her students ran against her grain. Clearly, any future project working from this portfolio design might want to think more carefully about the wisdom of external evaluators of classroom work stepping into the feedback lane of the classroom teacher. Based on this research I don’t think I would recommend it without much meditation. However, the following data slice also involving Martha depicts just the opposite effect, that is, Martha sees that external feedback can have a positive impact on students:
Before we move to the quantitative findings of the study, you need to know that the portfolio teachers secretly graded their students and supplied me with lists of letter grades they would have assigned to their students if they were the ones assigning grades based on the evidence in the portfolios and from their observations of the students. More on that in a bit.
Findings
I present next a table of statistical findings to provide some analysis of numbers from the measurement tools we used to evaluate the impact in the portfolio classrooms. Aware as I am about the volatility of numbers in the Humanities and among many teachers, know that these numbers are imperfect measurements. It isn’t just that there is scoring error. Limitations abound. The best way to look at them, I think, is as brute signifiers—summaries that can conceal as much as they reveal. However, like the STEM study of 3,000 students revealing a differential of .25 grade points between different curriculums and disciplines, some numbers are hard to ignore and deserve further consideration.
Take a short minute to orient yourself to the data collection tools—a writing test, a reading test, and a motivation survey, nothing fancy. Our hypothesis was that we would document significantly greater improvement in reading (which we did), writing (which we did not), and intrinsic motivation (which we did) when comparing scores from the portfolio students with those from the traditional instruction students.
Buckle Up
The following table serves as the foundation for the upcoming paragraphs, all about the quantitative data. I know. It looks a tad painful. Immediately after its display below, I offer you a hand to walk through it briskly with me. It doesn’t look friendly at first, but I want you to pay attention only to the middle column, the column labeled AllPT and the column labeled AllNT. PT and NT mean simply “portfolio teachers” and “non-portfolio teachers.” Note that I have some rich qualitative data to flesh out the story behind the numbers, but5 I need a lot more qualitative data to tell the whole story. I do not have any systematic qualitative data to provide a picture of the non-portfolio classrooms. That fact alone makes the AllPT score radically different in interpretation than the NonPT scores. Don’t forget that as I work my way through these data, but also don’t dismiss inferences from the numbers. .25 of a grade point difference across 3,000 college students isn’t nothing. The same is true here.
Writing by the Numbers
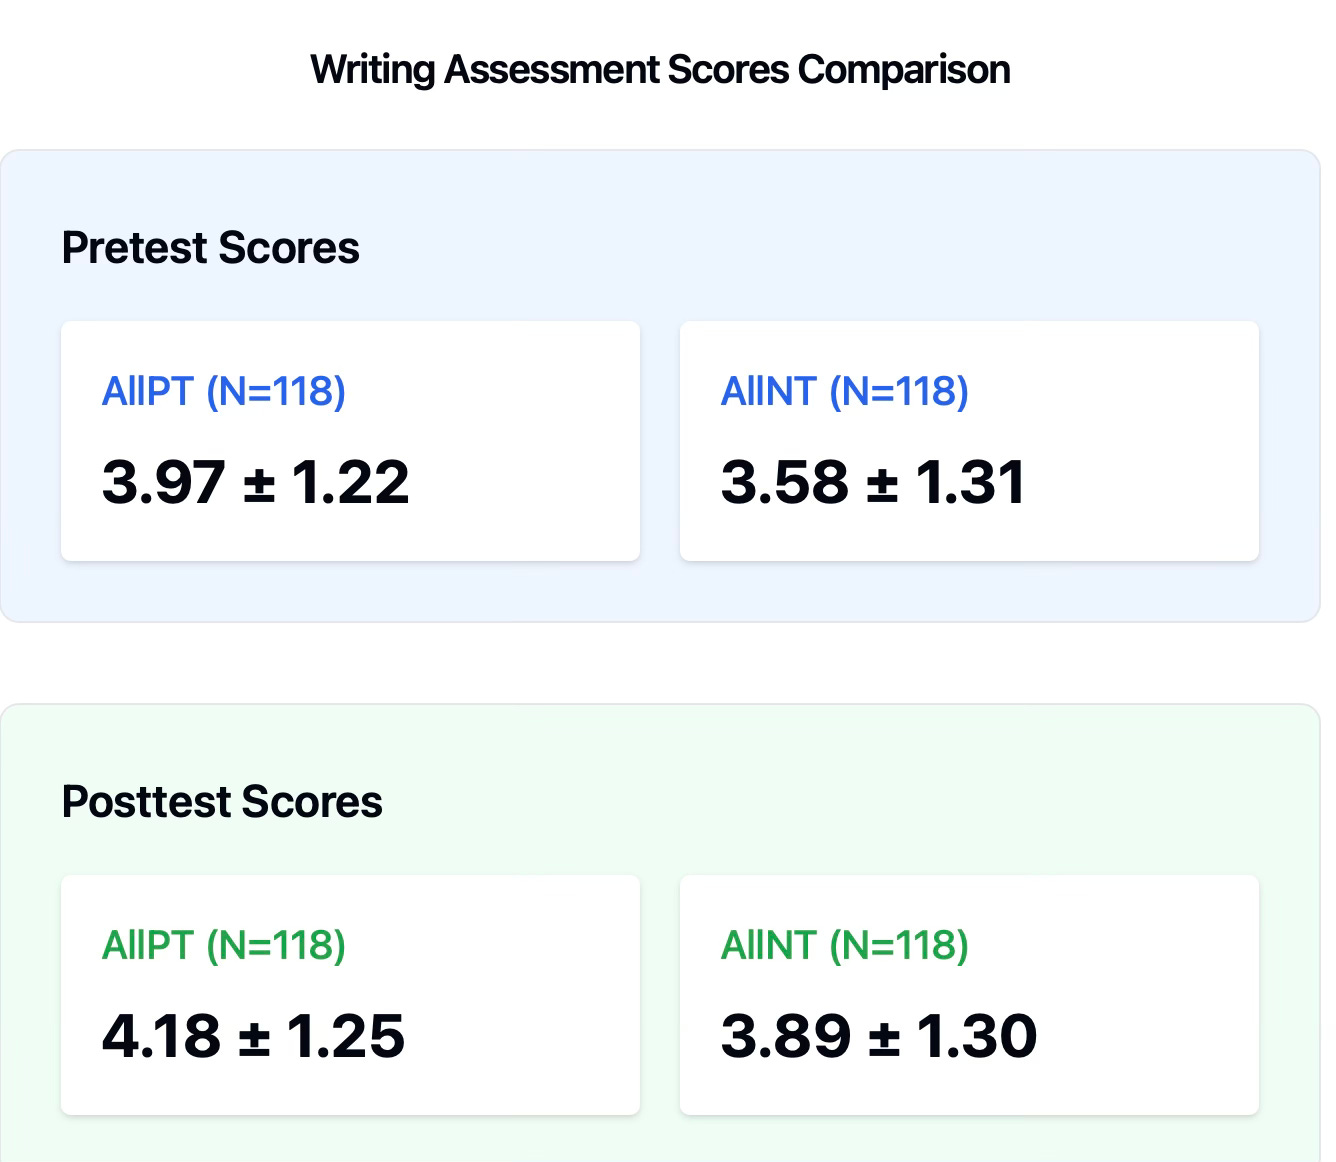
Let's examine the impact of portfolio pedagogy on student writing scores. At the start of the year, portfolio students already showed stronger writing performance, scoring 3.97 compared to traditional students' 3.58. This initial advantage of 0.4 points suggested the groups weren't evenly matched at the outset. Ordinarily, this would be an issue. How can we compare two groups of students vis a vis an intervention when they aren’t comparable at the start? Welcome to educational research. We can examine probabilities and draw provisional conclusions.
By year's end, portfolio students maintained their lead, scoring 4.19 while traditional students reached 3.89. However, this difference wasn't statistically significant, which means we can’t argue for a probable difference between the groups. More revealing was the pattern of growth: traditional students narrowed the gap from 0.4 to 0.3 points, showing slightly stronger improvement over the year. While portfolio students maintained higher absolute scores, they actually lost ground in relative terms.
This pattern makes it impossible to attribute any writing improvements to the portfolio approach. If anything, traditional instruction appeared to help students make marginally more progress, though both groups showed modest gains overall. This finding would be more meaningful if I had a field record of qualitative observations in the NT classrooms. Getting into those classrooms would have presented precarious and risky business, and the downside for the school could have been disastrous. So I chewed what I could bite off.
Reading by the Book
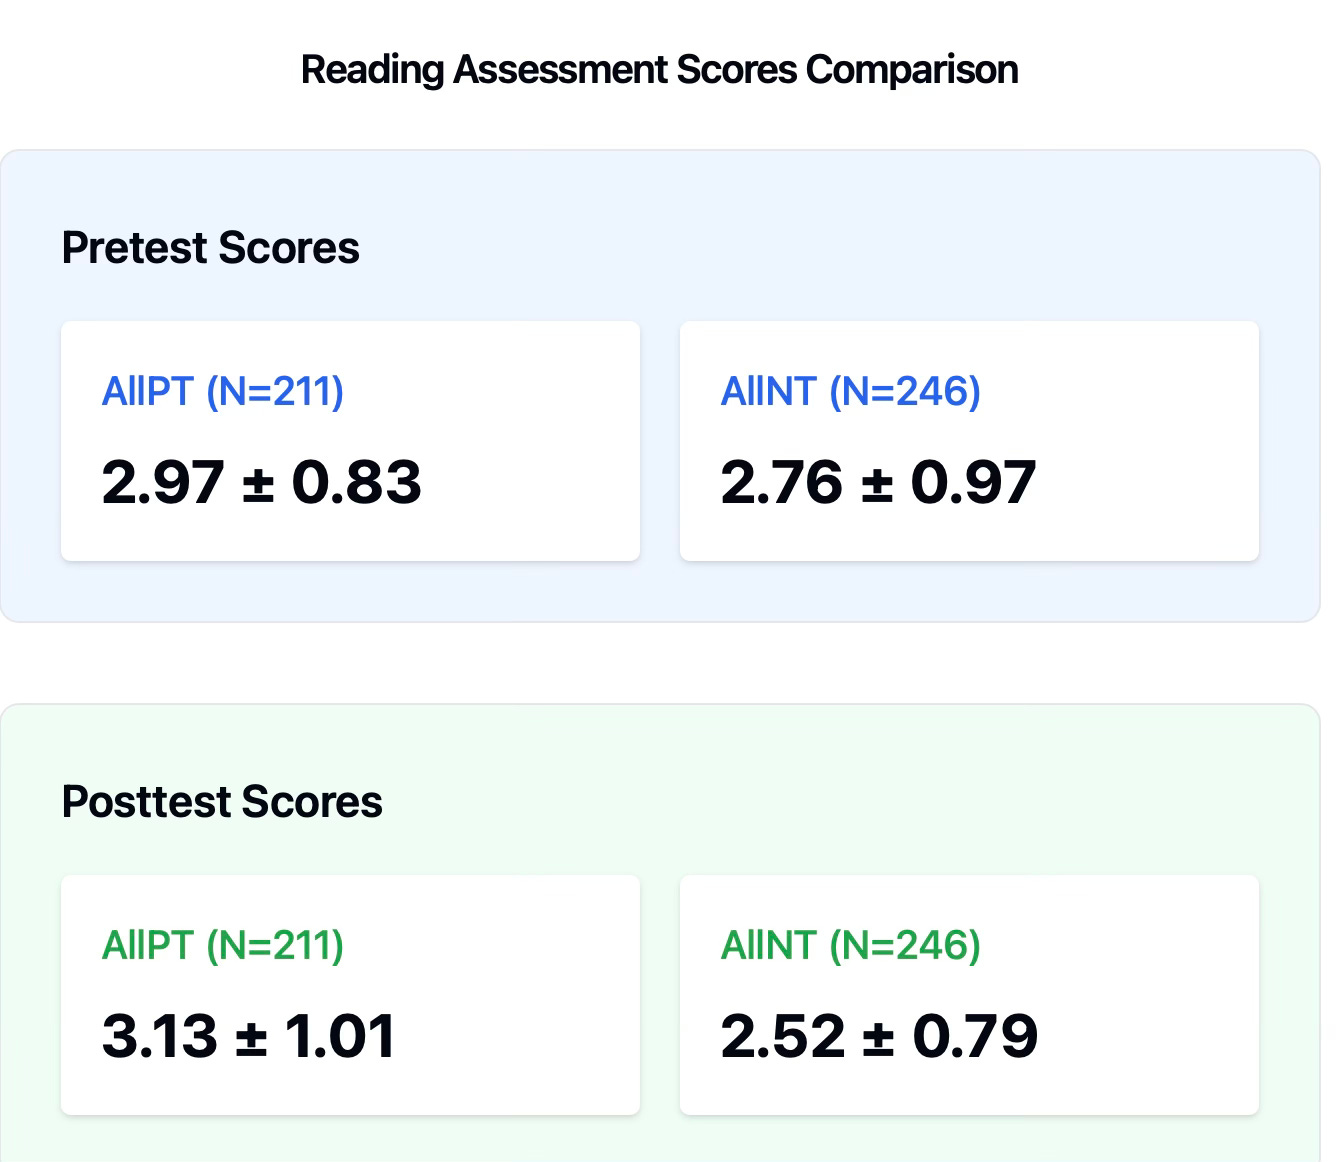
Unlike the writing data where traditional students narrowed the growth gap, the story in the reading data is strikingly different. Not only did portfolio students improve their reading scores, but traditional students actually lost ground. The growth gap for the NT students was stark. The initial gap in pretest scores of 0.21 points (2.97 - 2.76) widened significantly to 0.61 points (3.13 - 2.52) by year's end.
This pattern suggests that portfolio pedagogy may have had a protective effect on reading development, helping students continue to grow while their peers in traditional classrooms experienced a concerning decline. The divergence is particularly notable given that both groups started relatively close together but ended with a gap nearly three times larger.
We assume that portfolio students started academically stronger in both reading and writing, given the numbers. Of course, before you can evaluate my claims, you need to know much more about the measuring tools. Are they any good? My answer: Yes. The fact that my study underwent peer review as part of the dissertation work, when I submitted it to NCTE’s annual promising researcher award and won, and when I submitted a shorter report to the journal Educational Assessment, a top-tier journal, and was published, bolsters my “Yes.” But you need more. Unfortunately, presenting the argument for validity and reliability of measurements would take me into a technical jungle you can visit later if you feel like a safari. Let me clarify and nutshell this complex pattern and its implications:
Writing Story:
Traditional students began lower but grew faster (0.31 point gain), nearly reaching where portfolio students had started. While portfolio students still scored higher overall, their slower growth (0.21 point gain) suggested the gap was closing. This unexpected pattern (traditional instruction appearing more effective for writing growth) demanded closer investigation through qualitative methods. I can explain what happened—but not in the space I have here.
Reading Story:
A dramatically different pattern emerged in reading. Portfolio students not only improved (from 2.97 to 3.13) but seemed protected from the significant decline experienced by traditional students (from 2.76 to 2.52). This stark divergence suggests portfolio pedagogy may have been particularly crucial for reading development. Because the research in motivation to read shows a traditional yearly decline in reading sophistication beginning in adolescence, this finding is worth a look.
The Deeper Question:
Why would portfolio assessment appear to slow writing growth while supporting reading growth? This paradox led to qualitative investigation, detailed in my book The Portfolio Project (1999, NCTE) exploring how local contexts and practices influenced these contrasting effects. The numbers alone couldn't possibly tell the full story; understanding required actual classroom observations and local knowledge of teachers and students.
This is a perfect example of how quantitative findings often raise more questions than they answer, leading us toward deeper, more nuanced qualitative exploration of classroom life. It also illuminates why making unqualified judgments about the efficacy of a particular type of phonics instruction based on test scores is perilous. Science of Reading folks put all their eggs in the quantitative basket and give short shrift to documenting how classroom life in the treatment rooms actually rolled out. I admit the limitation—I didn’t study the control classrooms. They proceed to prescribe what a teacher should be doing in, say the tenth week of first grade. Moreover, rarely do they admit that numbers are probabilistic, not certain, unless the question is cut and dried like the APGAR. Did the baby live or die?
Digging Deeper Into The Reading Finding
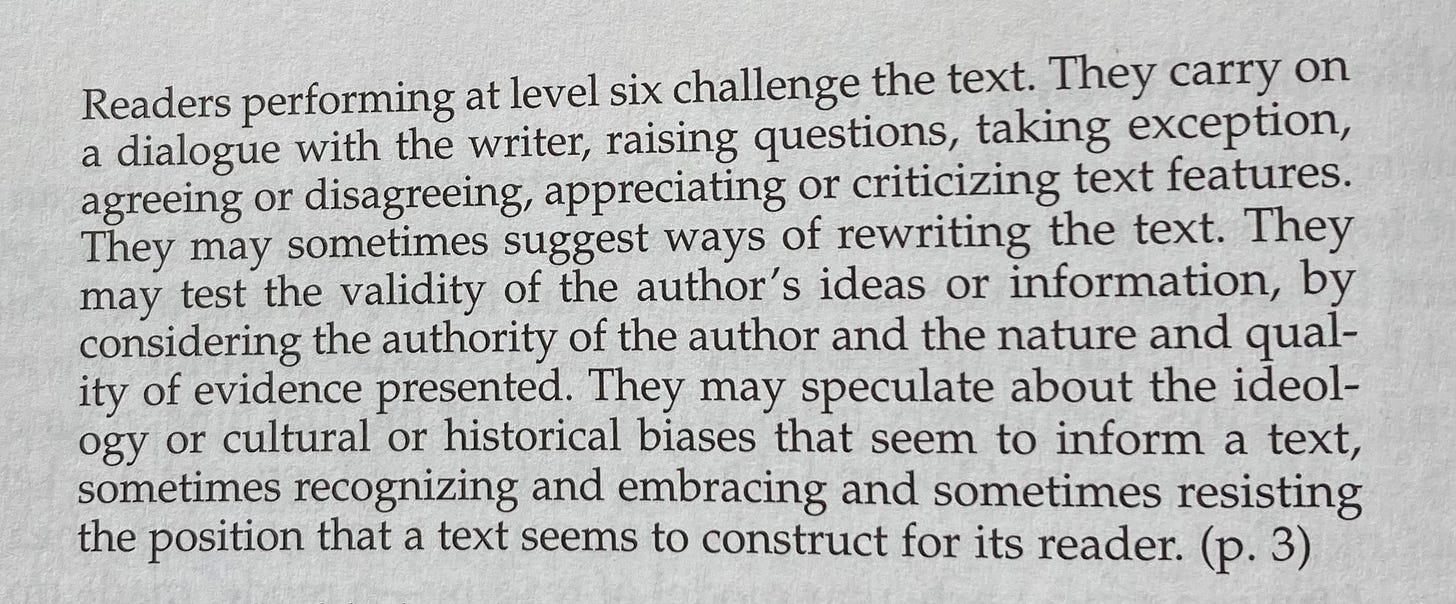
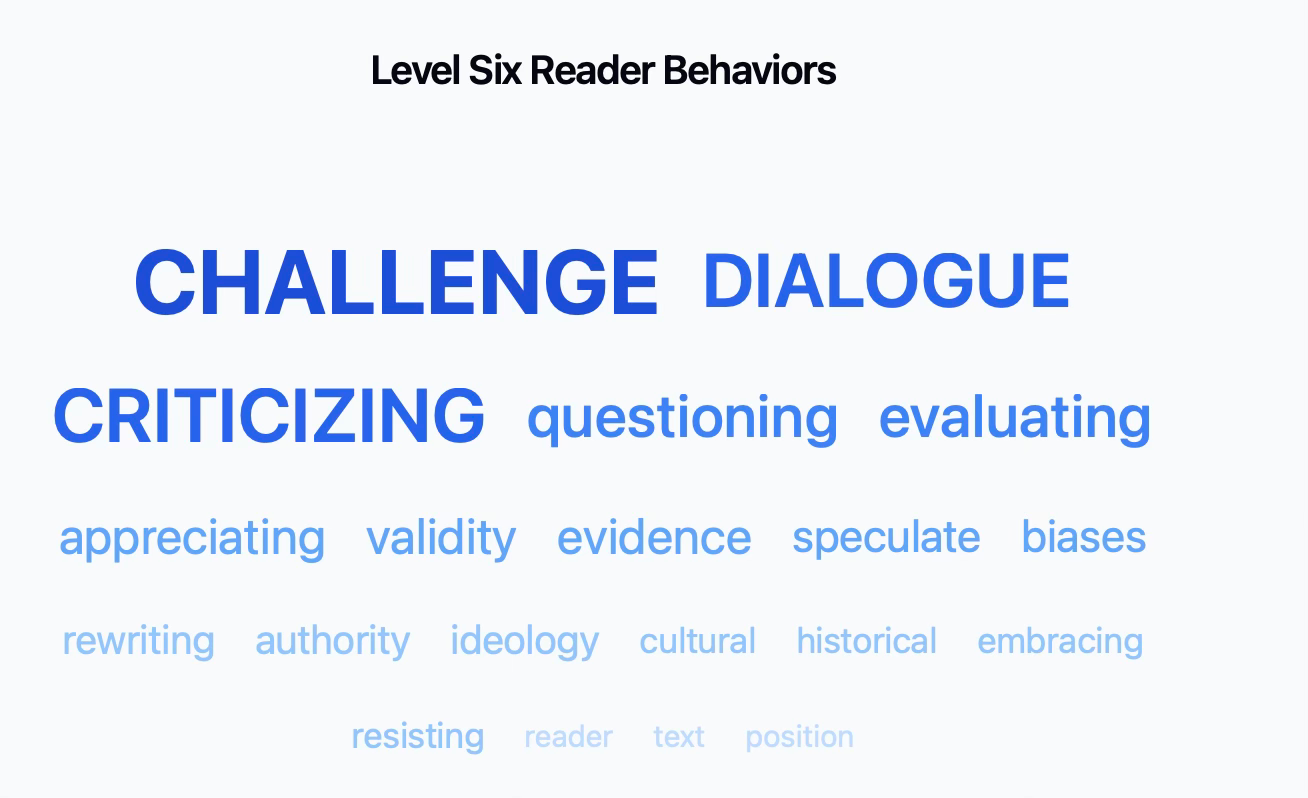
The following excerpt provides the language used in the classroom rubric for reading to communicate with learners the expectations for evidence of highly-accomplished reading performances. Note that this standard reduces to specific concrete reading moves that can be practiced, documented, and reflected upon:
In their portfolios, students submitted a complete set of each trimester’s reading logs, records they completed daily to document their work and thinking as a reader, and records they shared with their teacher and peers to get feedback on personal reading behaviors. To earn an “A” students were expected to read at least one hour per day in texts that challenged them. They wrote a “Log Entry Slip” for their formal portfolio indexing and reflecting on lessons learned, and they labeled evidence in their portfolios to scaffold the examination committtee’s work. This work in itself required them to take their own records seriously and to value them for lessons and insights. The following data slice is from a student’s reflection on the trimester, published in the 1999 article:
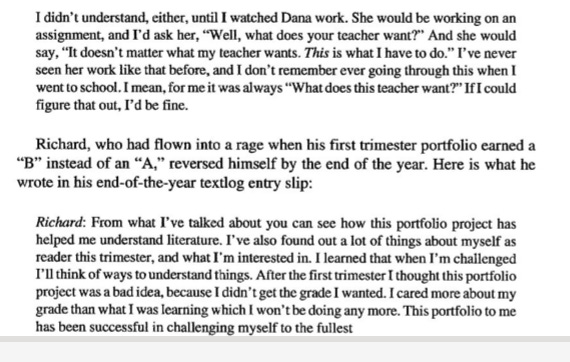
Something was clearly happening regarding reading in the folio classrooms based on the convergence of qualitative and quantitative evidence. I believe the theme of challenge, getting comfortable with it, owning it, may have had a big impact on students. The following recounts a response from a parent and an anecdote about Richard, one of my favorite examples of retreat from King ABCDF:
Academic Goal Orientation and Motivation
Findings from the academic achievement motivation survey administered near the end of the school year help explain what happened. The number of responses I was able to enter into the spreadsheet wasn’t as robust as I expected. It was clear to me from the surveys given in one of the traditional classrooms that the survey administration as directed by the classroom teacher positioned the survey as a pointless administrative task of no use or interest to her. I would love to have been an ethnographic fly on the wall during this administration of a psychological survey.
Some of the survey’s 24 questions showed all “1’s” or all “5’s,” or circles of variable circumferences haphazardly covering both “3” and “4”etc. One survey included an interesting caricature of a middle finger pointed at me. One survey included gigantic X’s over each page. I ended up eliminating most of the data from that bundle of surveys after a consult with Dr. Carl Spring, one of my mentors who helped me with the quantitative design and analysis.
Carl said that reducing the N (number of respondents) for the NT students might make it harder for me to show significance between the groups. Looking at the actual surveys with me, we decided together which ones to keep. I struggled with the question of simply deep-sixing all of them and going with two NT classes and three PT classes. But a handful of students must have taken the survey seriously. Their responses made sense in the aggregate, they didn’t deface the survey nor respond in unusual ways. I wanted to honor them for their help by including them come what may. Besides, I would present in good faith the data I was able to collect. That’s all I could do.
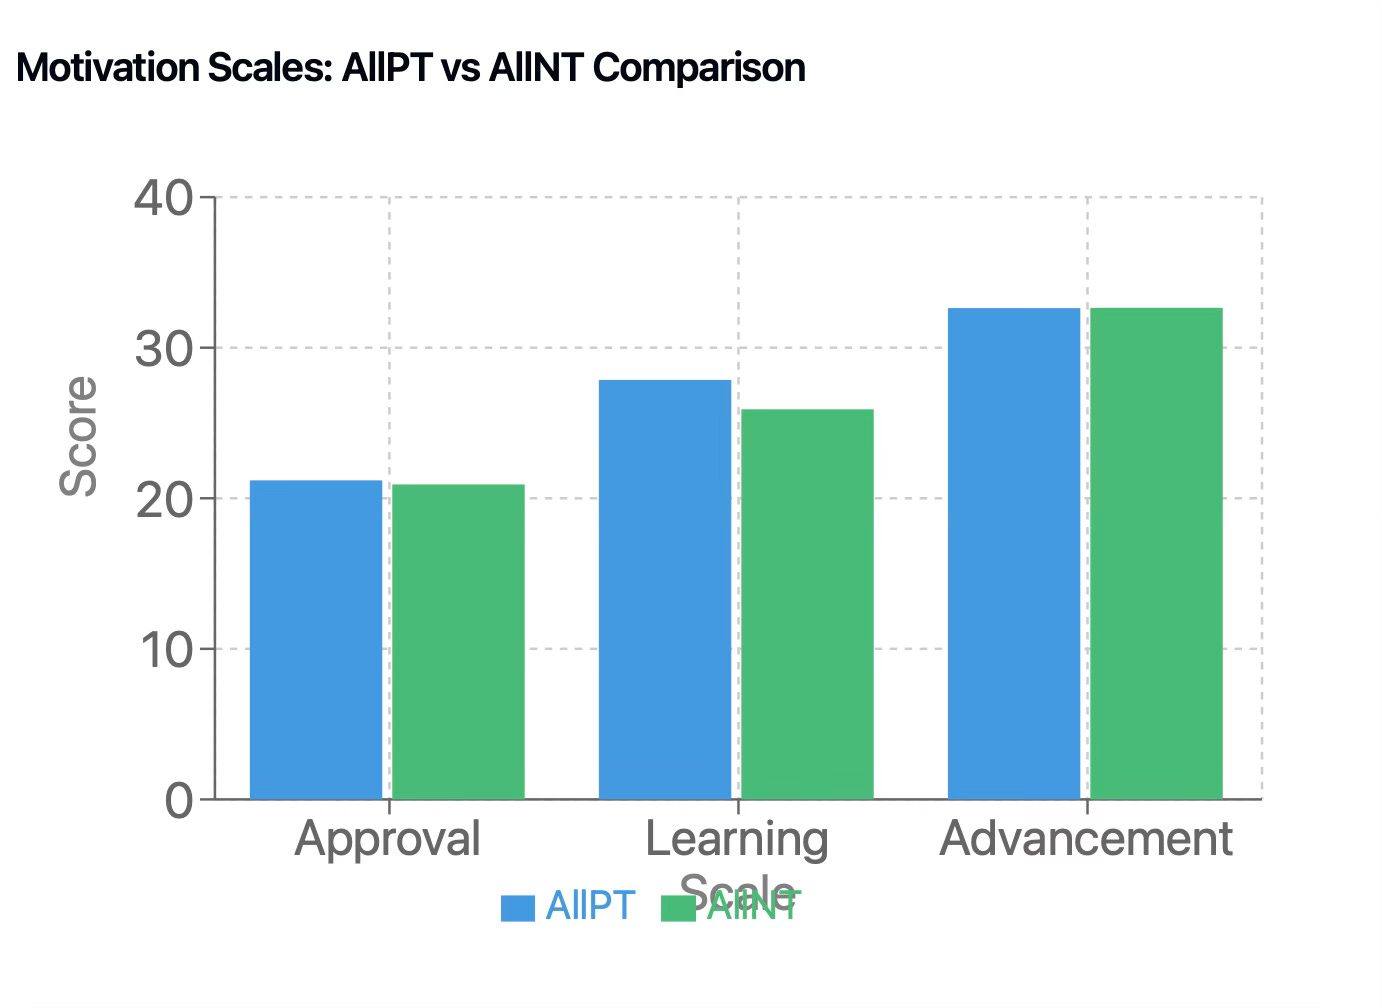
Based on a then influential model of academic goal orientation, my survey asked three sets of eight questions, each set about three distinct goal constructs: seeking approval from others, seeking a sense of learning and accomplishment, or seeking advancement in school. Questions ran along the lines of “I exert effort in this class to get approval from my family” or “I exert effort in this class because I feel that I am improving.” The scale went from “1” = strongly disagree to “5” = strongly agree.
So looking at the data, I note approval was low in both conditions: AllPT and AllNT at 21 with very similar standard deviations. I expected this finding based on previous research findings. Advancement was 32.65 on AllPT and AllN); just as the approval means agreed across the totality of survey respondents, the advancement means aligned perfectly. These kids didn’t work for approval, and when they did exert effort in the service of achieving an academic goal, it was mostly driven by the desire to advance to the next level, to climb higher, to earn good grades as a means to extrinsic academic advancement.
When we finally reach the learning motive, intrinsic or mastery as the driver of effort, the motive that transcends the moment even as it amplifies it, here is the story: 27.56 to 25.91. AllPT registered a learning intensity at 27.56 in contrast with an AllNT mean of 25.91. A statistically significant difference, this finding is probable evidence (95% certainty) of an increase in the learning motive over the course of a school year attributable to the portfolio pedagogy and to reconstituted academic power relations.
InterGrader Reliability
Previously, I told you about collecting grades from the portfolio teachers based on their gut. Those grades would be used to calculate intergrader reliability. If the portfolio teacher were grading each student according to their own lights, what grade would they have given the student keyed to the learning criteria? The following table published in Underwood and Murphy (1998)3 includes all of the grades as recorded in transcripts for the portfolio students as well as all of the grades the folio teachers would have given. By the way, there were no serious arguments about grades between the examiners and the teachers, no yellow sticky battles.
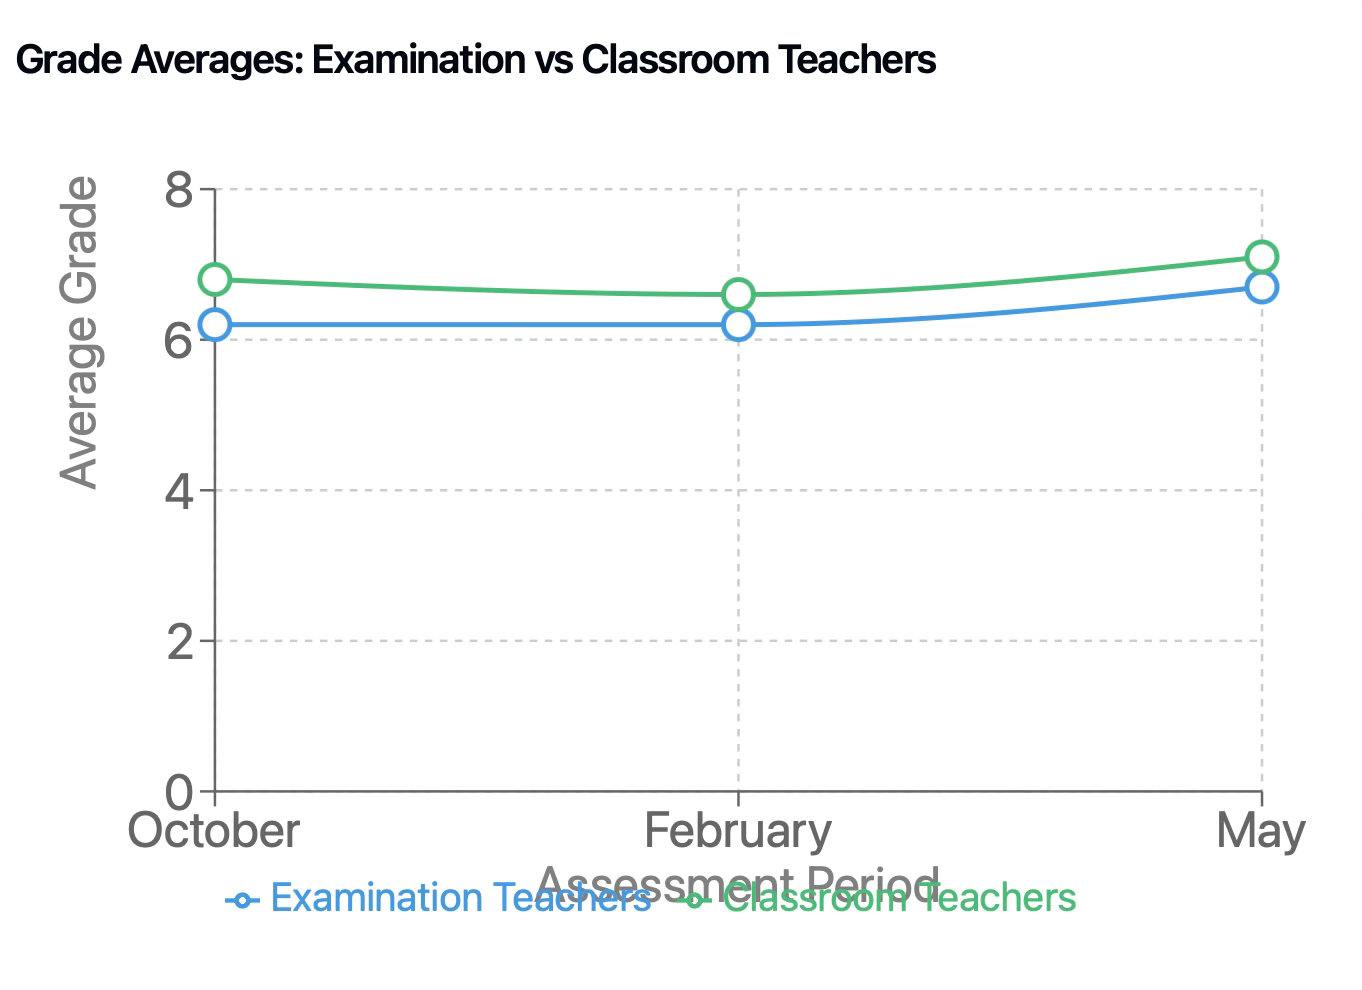
Mean scores at the bottom of the table are interesting. The examination teachers scored on average lower each session than the classroom teachers. If I were to have done a followup study, I would have interviewed the teachers separately just on this question: Why? Nonetheless, the means for both sets of teachers fell inside the 6 point score on a 13-point scale. One generalization for research: Teachers who spend serious time working with students as mentors and coaches rather than judges might tend to value student work product a bit more highly than outside examiners, even very close colleagues who routinely collaborate. Naturally occurring bias attributable to the intimate relations of teaching could be critical in explaining why in the Humanities grades are .25 pts. higher than in STEM classes.
The following table presents technical data regarding the degree to which classroom teacher scores aligned with examination teachers. In the 2005 article, Sandy and I discuss an interpretation arguing for these numbers as evidence of good interrater reliability.
IV. Proof of Concept
This transformation of English classrooms at Ruff Middle School demonstrates that reimagining assessment and evaluation isn't to be achieved by theory—it's achievable through pragmatic, professional, structural change. Their experience proves that teachers can collaborate to develop local standards and that grades can serve learning as much as they serve sorting and ranking. This happened without extraordinary resources or circumstances; it required only time for teacher collaboration and willingness to challenge traditional assessment assumptions.
Start small: a department can begin by examining student work together, developing shared language about growth, and inviting students into reflection about their learning. Think big: entire schools can reorganize to support teacher collaboration and portfolio assessment. Ruff's experience shows both paths are possible—whether taking first steps or reimagining the whole system, the key is choosing to work differently together. When we do, assessment can truly serve learning as both growth and accomplishment. The affordances of LMSs and electronic portfolios are useful, but the real work is all too human. As much as we’d like to think of GPA’s and test scores as the outcome of education, it’s just not true. As a wise person once said, learning is what is left after everything else that happens in school falls away.
Footnotes:
1: Readers will find a complete explanation of the mixed methods employed in the study from several different sources. Please email me at tlunder@csus.edu and explain your interest. I’ll respond with a source url that I think will meet your interests.
2: The Consequences of Portfolio Assessment: A Case Study.
Underwood, Terry
Educational Assessment, v5 n3 p147-94 1998
Presents findings of a year-long study of a language arts portfolio-assessment system in a California middle school in which an external evaluation committee applied a rubric to student portfolios from three teachers' classes.
3: Underwood. T. and Murphy, S. (1998). Interrater Reliability in a California Middle School English/Language Arts Portfolio Assessment Program. Assessing Writing 5(2).
Introducing Two AI Literacy Courses for Educators
Pragmatic AI for Educators (Pilot Program)
Basic AI classroom tools
Pragmatic AI Prompting for Advanced Differentiation
Advanced AI skills for tailored instruction
Free 1-hour AI Literacy Workshop for Schools that Sign-Up 10 or More Faculty or Staff!!!
Free Offer:
30-minute strategy sessions
Tailored course implementation for departments, schools, or districts
Practical steps for AI integration
Interested in enhancing AI literacy in your educational community? Contact nicolas@pragmaticaisolutions.net to schedule a session or learn more.
Check out some of my favorite Substacks:
Mike Kentz’s AI EduPathways: Insights from one of our most insightful, creative, and eloquent AI educators in the business!!!
Terry Underwood’s Learning to Read, Reading to Learn: The most penetrating investigation of the intersections between compositional theory, literacy studies, and AI on the internet!!!
Suzi’s When Life Gives You AI: An cutting-edge exploration of the intersection among computer science, neuroscience, and philosophy
Alejandro Piad Morffis’s Mostly Harmless Ideas: Unmatched investigations into coding, machine learning, computational theory, and practical AI applications
Amrita Roy’s The Pragmatic Optimist: My favorite Substack that focuses on economics and market trends.
Michael Woudenberg’s Polymathic Being: Polymathic wisdom brought to you every Sunday morning with your first cup of coffee
Rob Nelson’s AI Log: Incredibly deep and insightful essay about AI’s impact on higher ed, society, and culture.
Michael Spencer’s AI Supremacy: The most comprehensive and current analysis of AI news and trends, featuring numerous intriguing guest posts
Daniel Bashir’s The Gradient Podcast: The top interviews with leading AI experts, researchers, developers, and linguists.
Daniel Nest’s Why Try AI?: The most amazing updates on AI tools and techniques
Riccardo Vocca’s The Intelligent Friend: An intriguing examination of the diverse ways AI is transforming our lives and the world around us.
Jason Gulya’s The AI Edventure: An important exploration of cutting edge innovations in AI-responsive curriculum and pedagogy.


